Client
GROW Inc.
Date
2024
Duration
8 weeks
Team
Ashleigh Beath, Anisa Edwards, Alex Constanti, Jimmy Tang, Sam Goodger, Lorence Tolentino, Dhruv Mohindru, Dawid Wrzos, and Stanley Wu
Product Design — Dashboard and workload Management
Dashboards provide a comprehensive overview of key performance indicators (KPIs), service level agreements (SLAs) and case volumes. By centralising real-time, critical metrics, it enhances operational efficiency, improves decision making, compliance with internal and regulatory standards, as well as ensures high-quality service across multiple funds.
This body of work formed part of the broader workflow and workload initiative, complimenting Case Management beta and was critical to enabling proactive decision making as GROW scaled.
Design problem
As GROW scaled its administration services and onboarded more funds, Australian Ethical (AE), HESTA, NGS Super and Christian Super, operational complexity increased signficantly.
The existing reporting tool operated with a 24 hour latency, providing only retrospective insights, rather than real-time actionable insights. This led to SLA breaches, challenges in managing workloads and difficulty maintaining high-quality service across multiple funds.
Due to this, administrative leaders were required to assess these reports, manually filter Case Management (classic and beta) to understand workload and allocate work appropriately, a significantly time consuming process that could not scale as volumes increased.
Similarly to Case Management, the Dashboard body of work had spent two years in discovery and design without progressing into delivery, highlighting the urgent need to prioritise and move decisively from discovery to iterative delivery.
Primary objectives
Given the urgency and the need to support different hierarchies, we broke this intiative into multiple miltestones of delivery. Our primary objectives for case dashboards included:
- Establishing a clear delivery path to avoid long running, stalled initiatives and bring continuous value, increasing velocity
- Learning, adapting and resolving quickly
- Reduce time spent on identifying and allocating cases manually
- Enabling proactive workload management by providing Team Leads with sufficient data for case allocation
- Ensuring real-time visibility into cases, including case volumes and case SLAs, case volumes per each team and per administrator
- Preventing SLA breaches through real-time data, providing early idenfitication of at risk cases (primarily for intra-day SLAs)
- Maintaining compliace with contractural agreements and client sensitivities around data visibility
- Enabling users to drill down from aggregated views into a filtered Case Management Beta view for immediate action
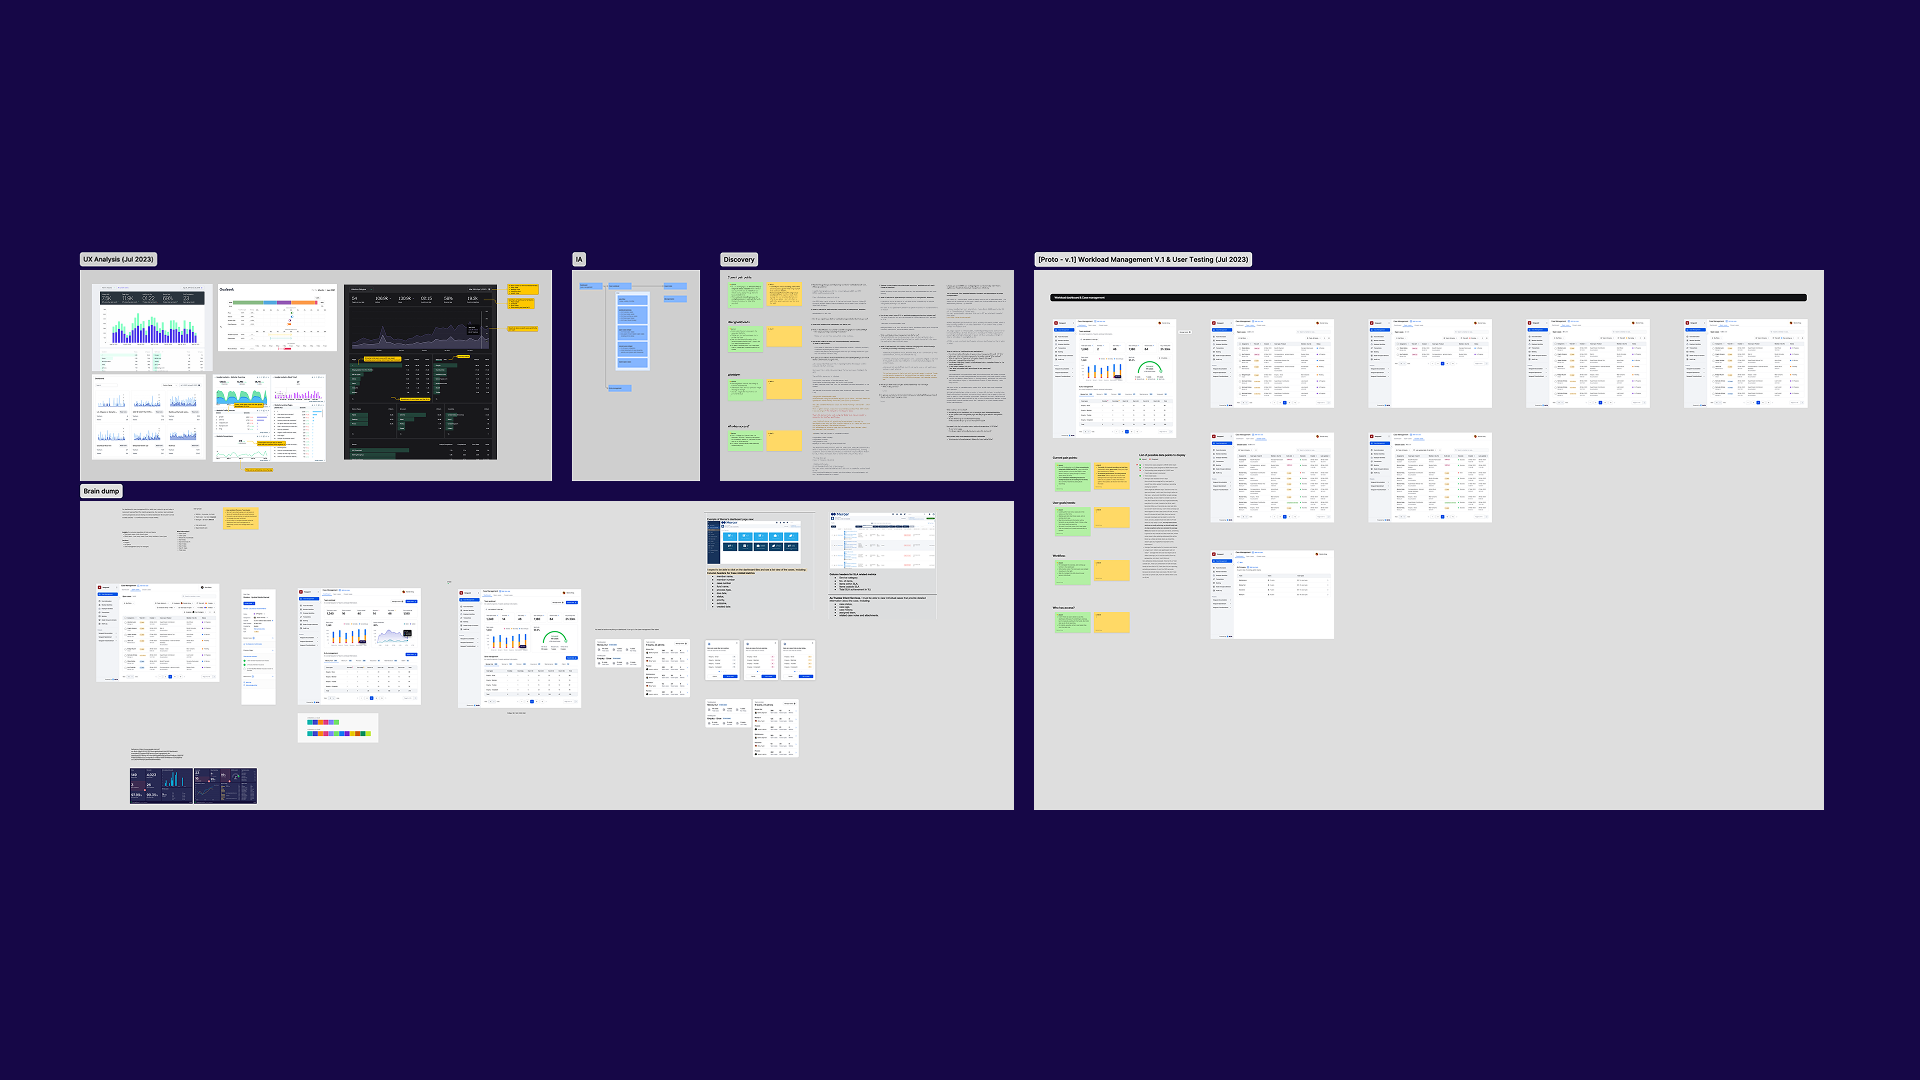
Design synthesis
To kick off this initiative, I reviewed the existing discovery work and found it was largely undocumented, consisting only of a single user interview session with an Administrative Team Lead and the Head of Superannuation.
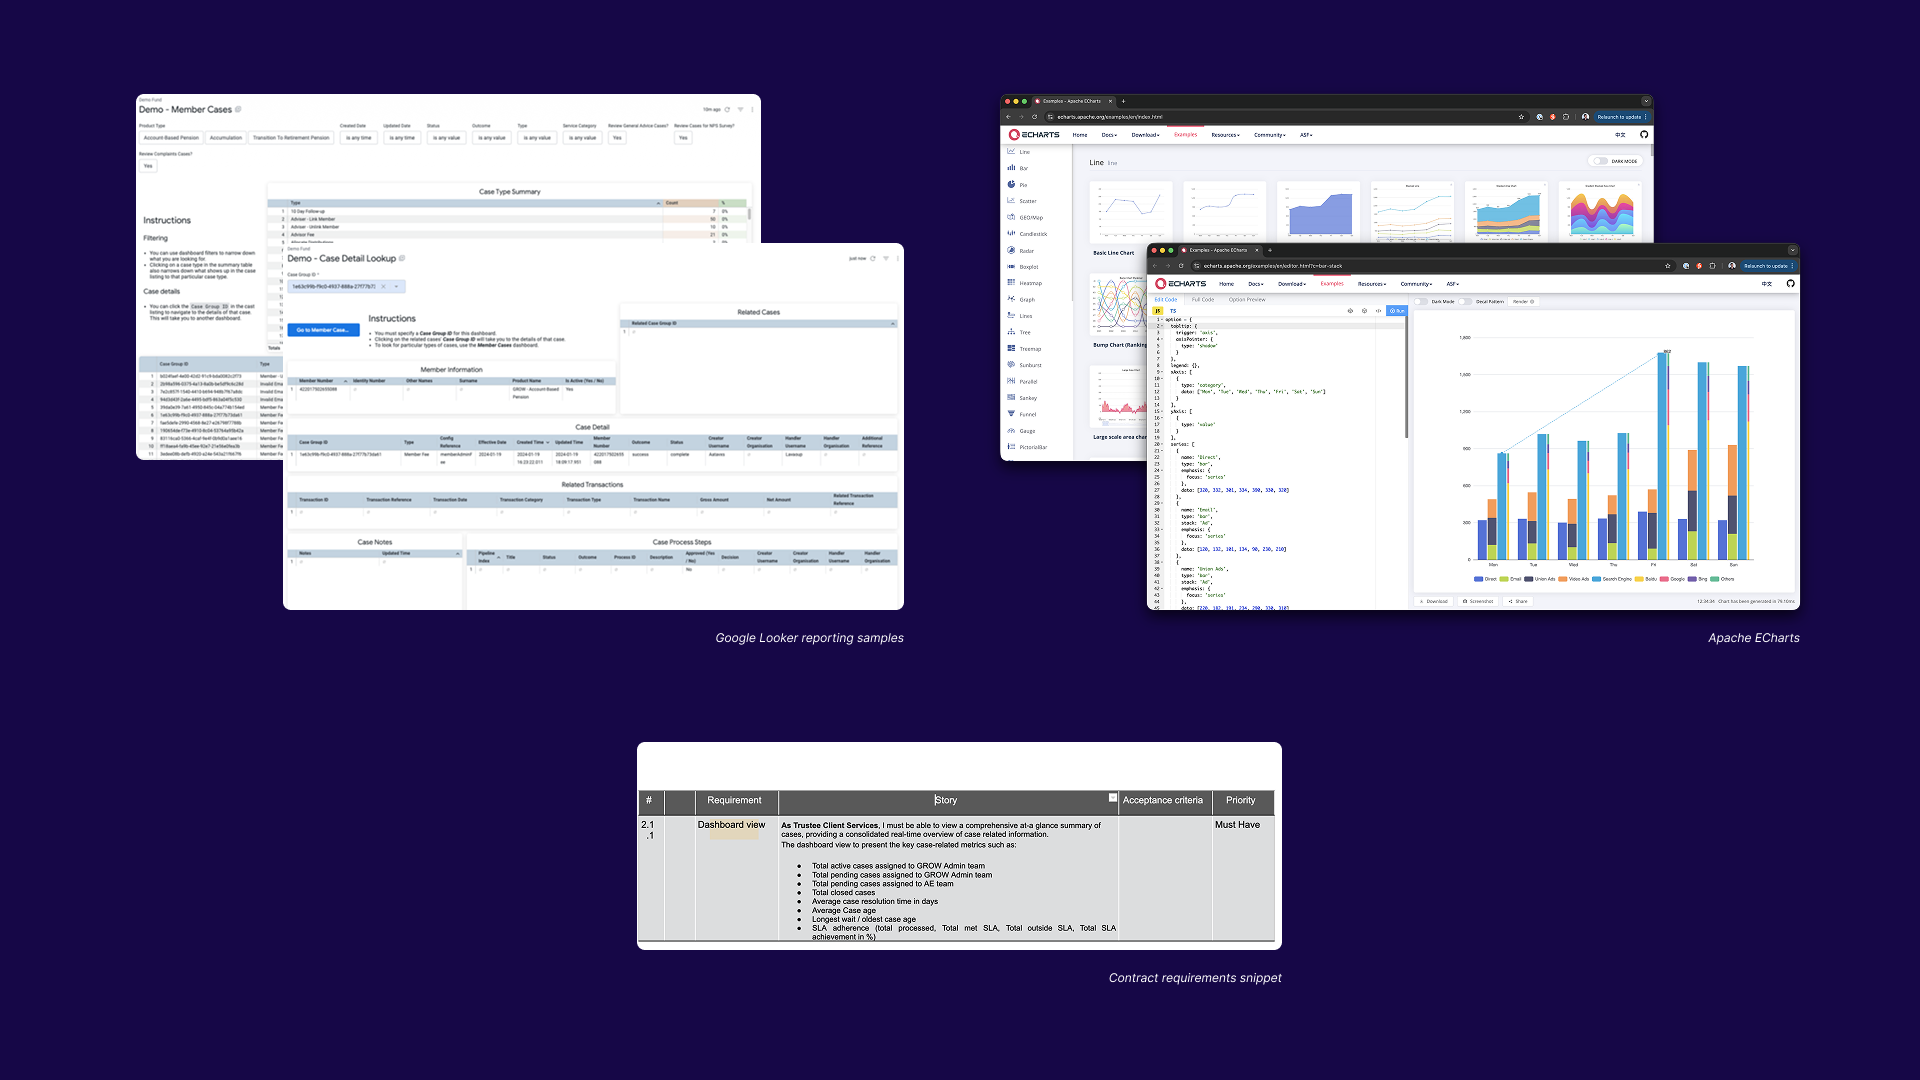
I then assessed the existing UI solution and re-evaluated the proposal to understand how it addressed the needs surfaced by the business and the existing discovery.
This led me to identify four questions that could help better align the end solution to the problem.
- What does our current reporting infrastructure provide to support our administrators and funds?
- Are there contractual agreements around reporting or dashboards that may influence requirements, given that Trustees have access to DLTA?
- How do administrators currently manage workloads, understand volumes and meet SLAs?
- How might we design dashboards for different user groups aligned to their specific needs?
Additional user interviews
To uncover answers to these questions, I formulated a discovery plan executed over 1 week that involved:
User interviews and shadowing sessions with internal administrators
- 4 Team Leads
- 4 Administrators
- Head of Superannuation
Stakeholder alignment sessions
- Reporting Product Manager, to understand existing reporting capabilities (SSRS and Looker), current challenges and any enhancements that could influence the DLTA Dashboard
- Head of Product Core Foundations, to understand if GROW has any contractual obligations that may influence requirements and thus impact the end solution
- Engineering, to understand if we had an existing graph library to determine what visualisations we could support and the complexity of implementation
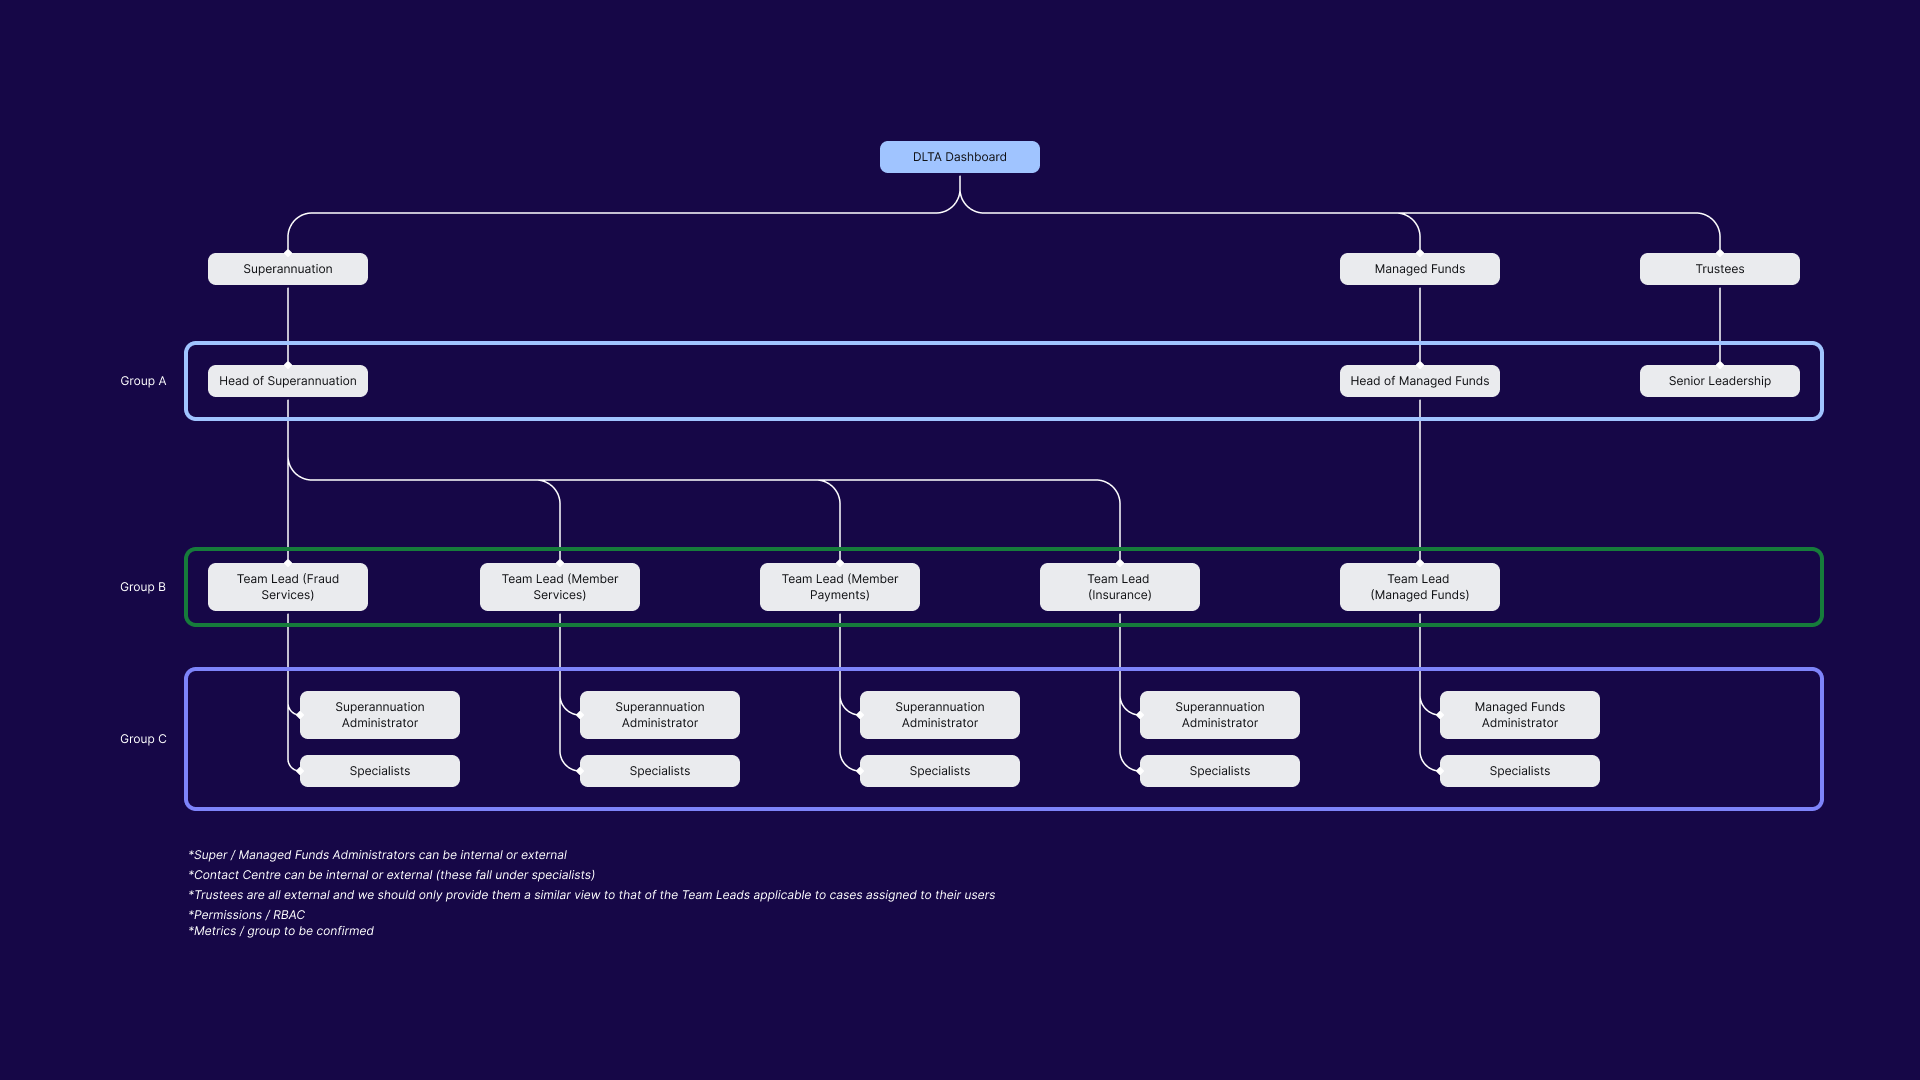
What was uncovered?
From our administrators
- Team Leads use the latent reports to assess how many cases are in the queue in order to distribute work accordingly (this was prior to Case Management beta)
- Team Leads use the latent reports to assess individual administrator workload and performance
- Head of Superannuation used the latent reporting data in a separate spreadsheet for forecasting and workload management
- Head of Superannuation used the latent reporting data in a separate spreadsheet to determine average time of completion per case type
- Administrators relied heavily on reports to assess potential SLA breaches, however intra-day SLAs could not be determined
- Administrators were frustrated about not having clear visibility of their cases in DLTA and the lack of real-time data to help complete their work
From reporting
- Reporting operated with a 24 hour latency and could not be optimised to deliver real-time data due to technical limitations
- Reports were also not standardised across all clients due to business pressures
From Head of Product
- Australian Ethical was the only customer with a contractural obligation, requiring Trustee Client Services to view a comprehensive at-a-glance summary of cases with real-time overview of case-related information
- Required metrics include, total active cases (GROW Admin team), total pending cases (GROW Admin and AE team), total closed cases, average case resolution time, average case age, longest wait/oldest case age and SLA adherence (total processed, total met, total outside SLA, total SLA achievement %)
From Engineering
- Apache ECharts was the existing visualisation library and I was able to validate configurability through testing, however, some of the proposed chart types from the existing solution could not be supported
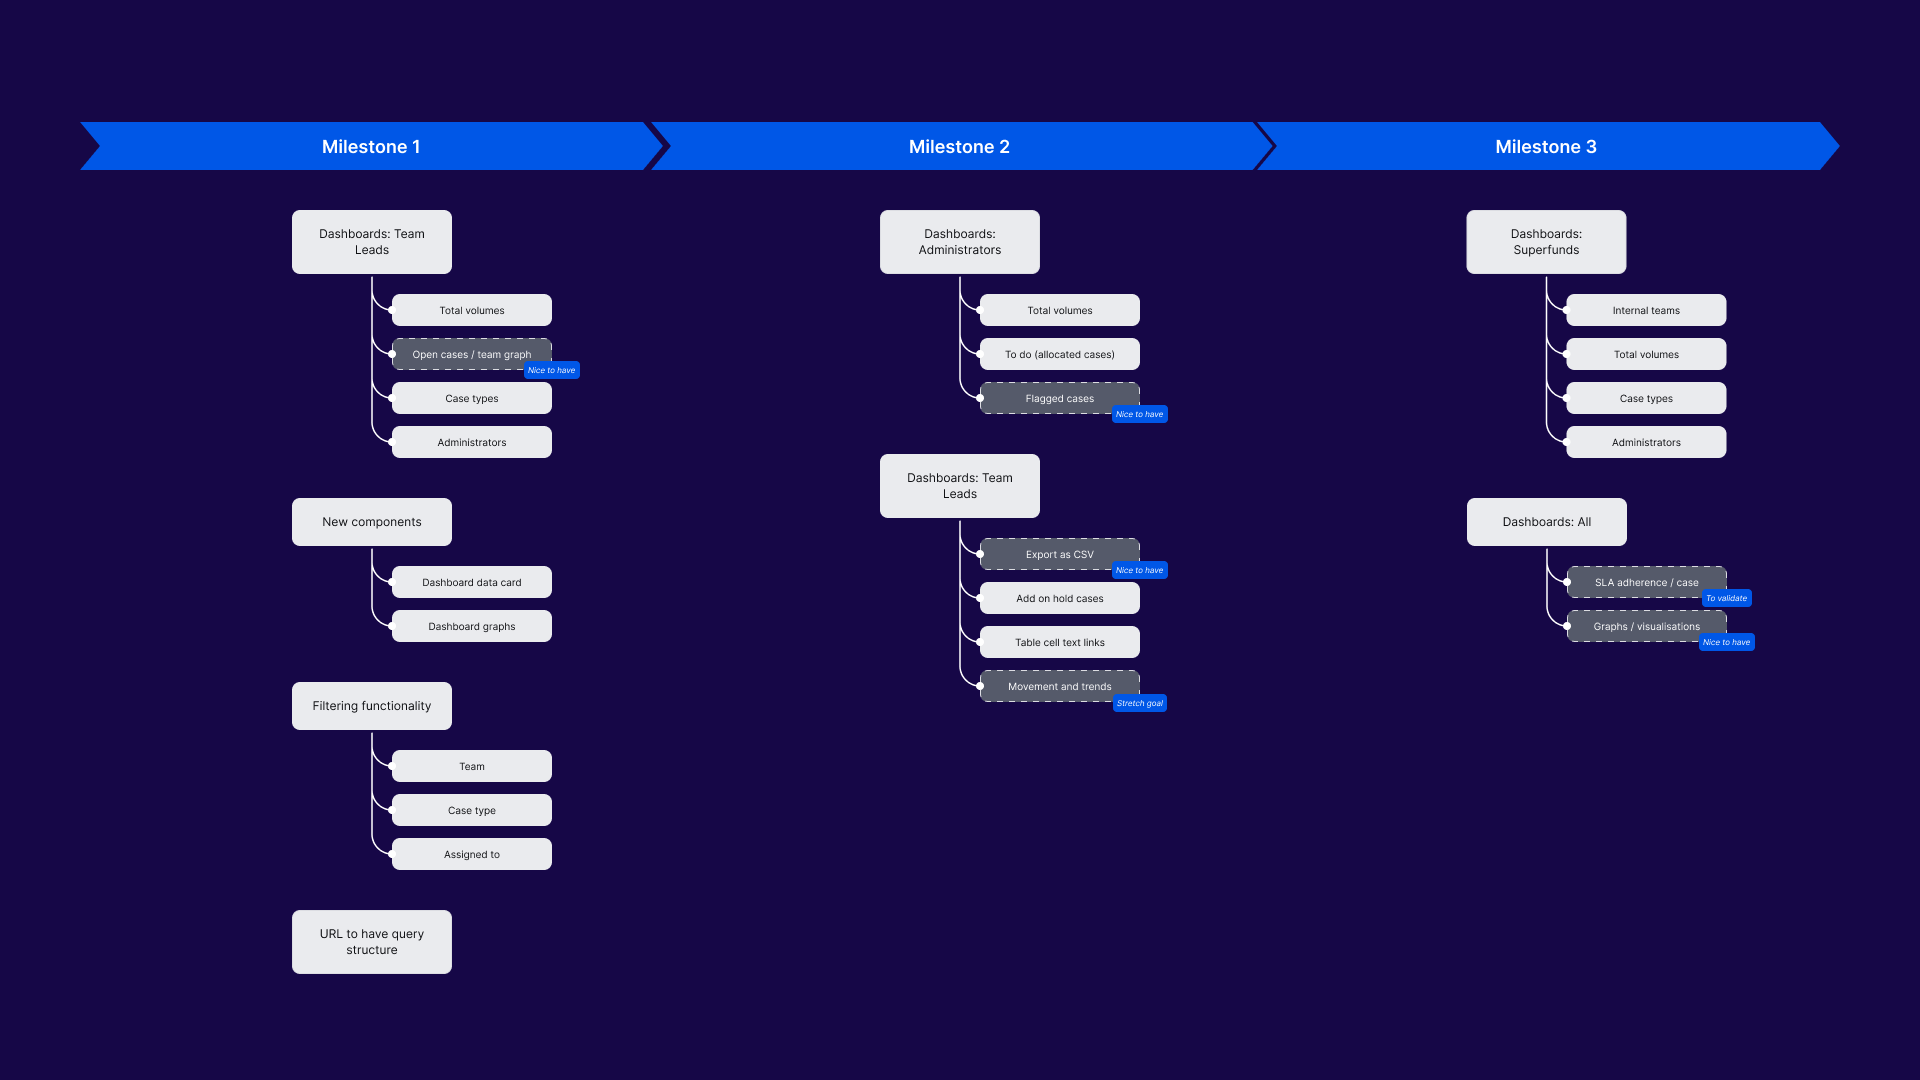
High-level planning
I approached Dashboards the same way as Case Management, working closely with the Product Manager and Engineering Lead to break down, prioritise and plan for the delivery of this initiative,
This resulted in a high-level plan that created focus within the team and enabled the incremental delivery of value and functionality, aligned with business needs and laying the foundations for longer term capability.
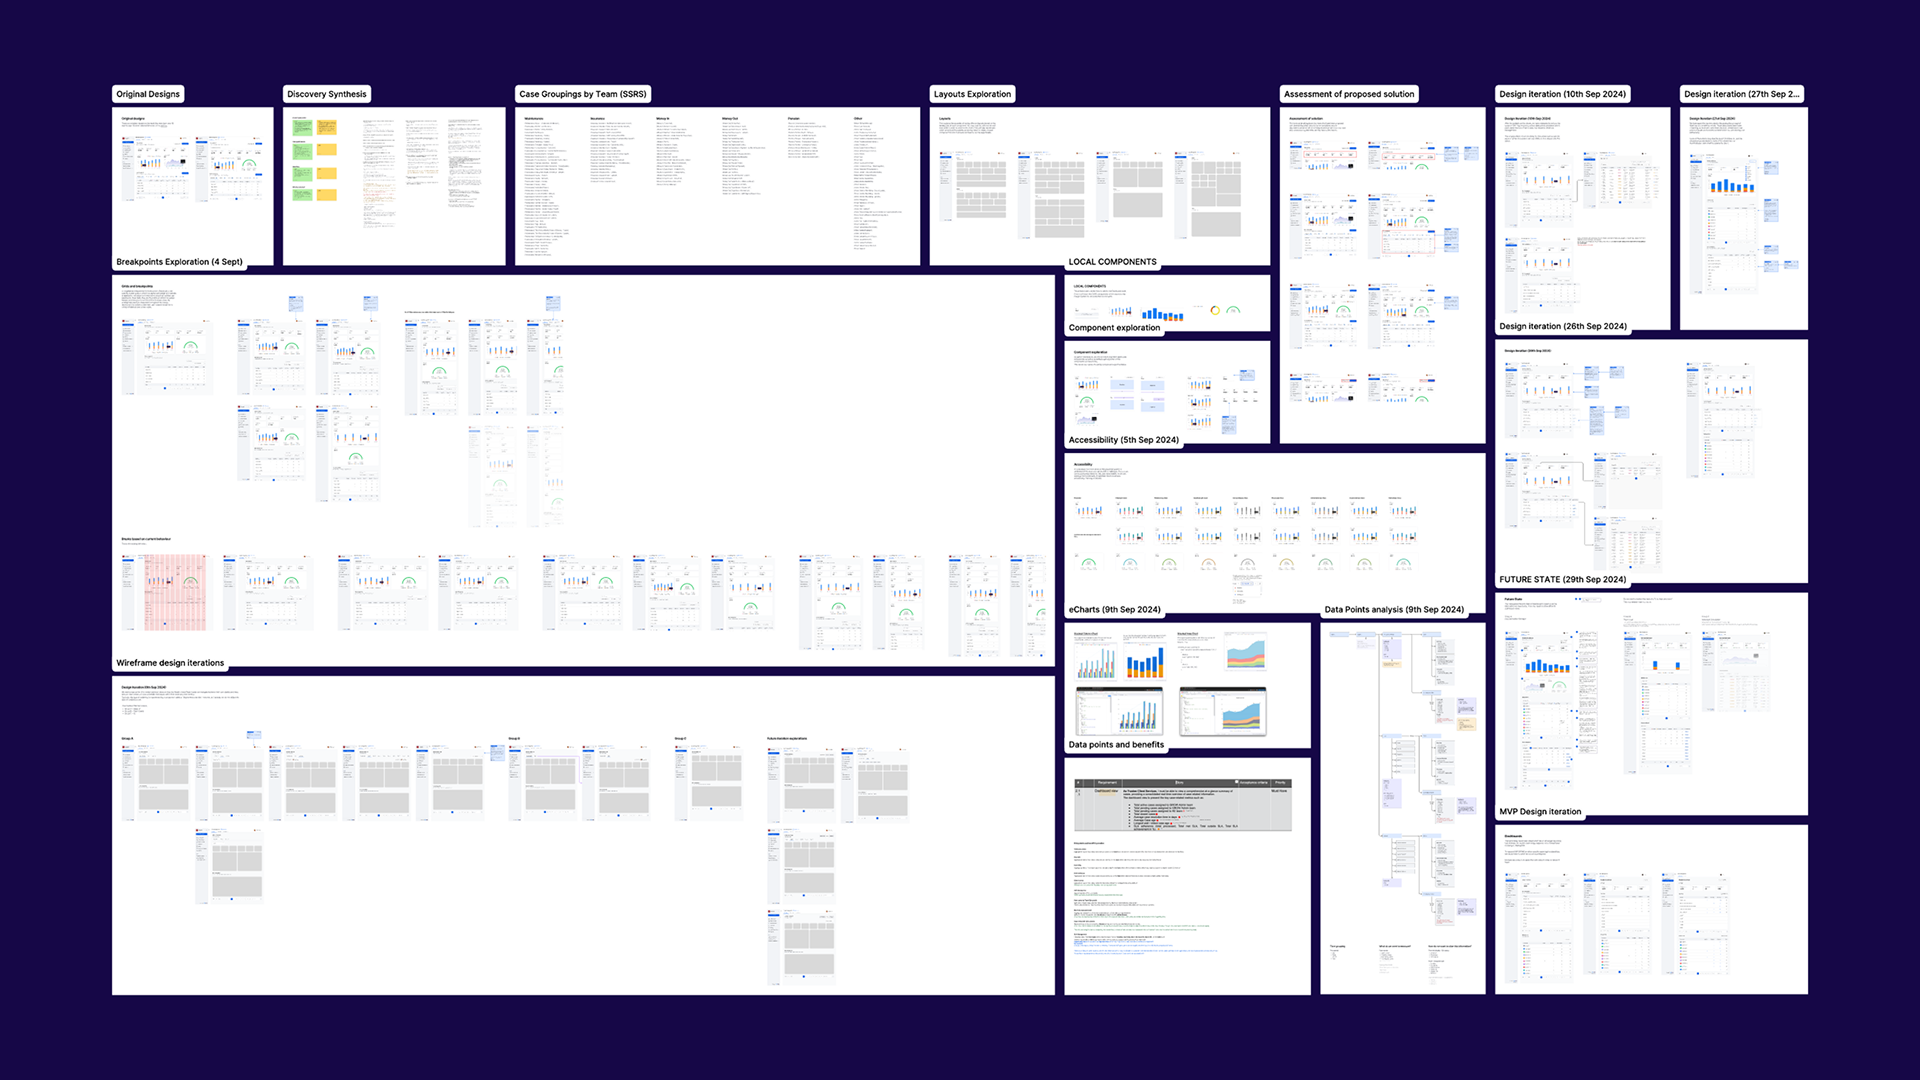
Design iterations
There was significant pressure from the business to deliver Dashboards earlier than our intended plan. To meet these timelines, I had to further simplify the proposal to be achievable within the timeline and technical constraints whilst still providing value to our administrators.
In parallel, I worked with the Head of Product, Reporting PM and Core PM to align on the feature direction and discuss the contractual requirements. We determined that a majority of the data points they required should come from reports rather than the real-time Dashboards. This approach recognised that our reporting function already delivered the requested data points and the upcoming Domain Events initiative would enable reporting to become real-time and on-demand.
Validating with administrators
To ensure our administrators remained informed, I conducted a playback session, discussing the changes being made to the proposal. This session served as both a validation checkpoint and an opportunity to maintain trasparency around the scope changes driven by business timelines.
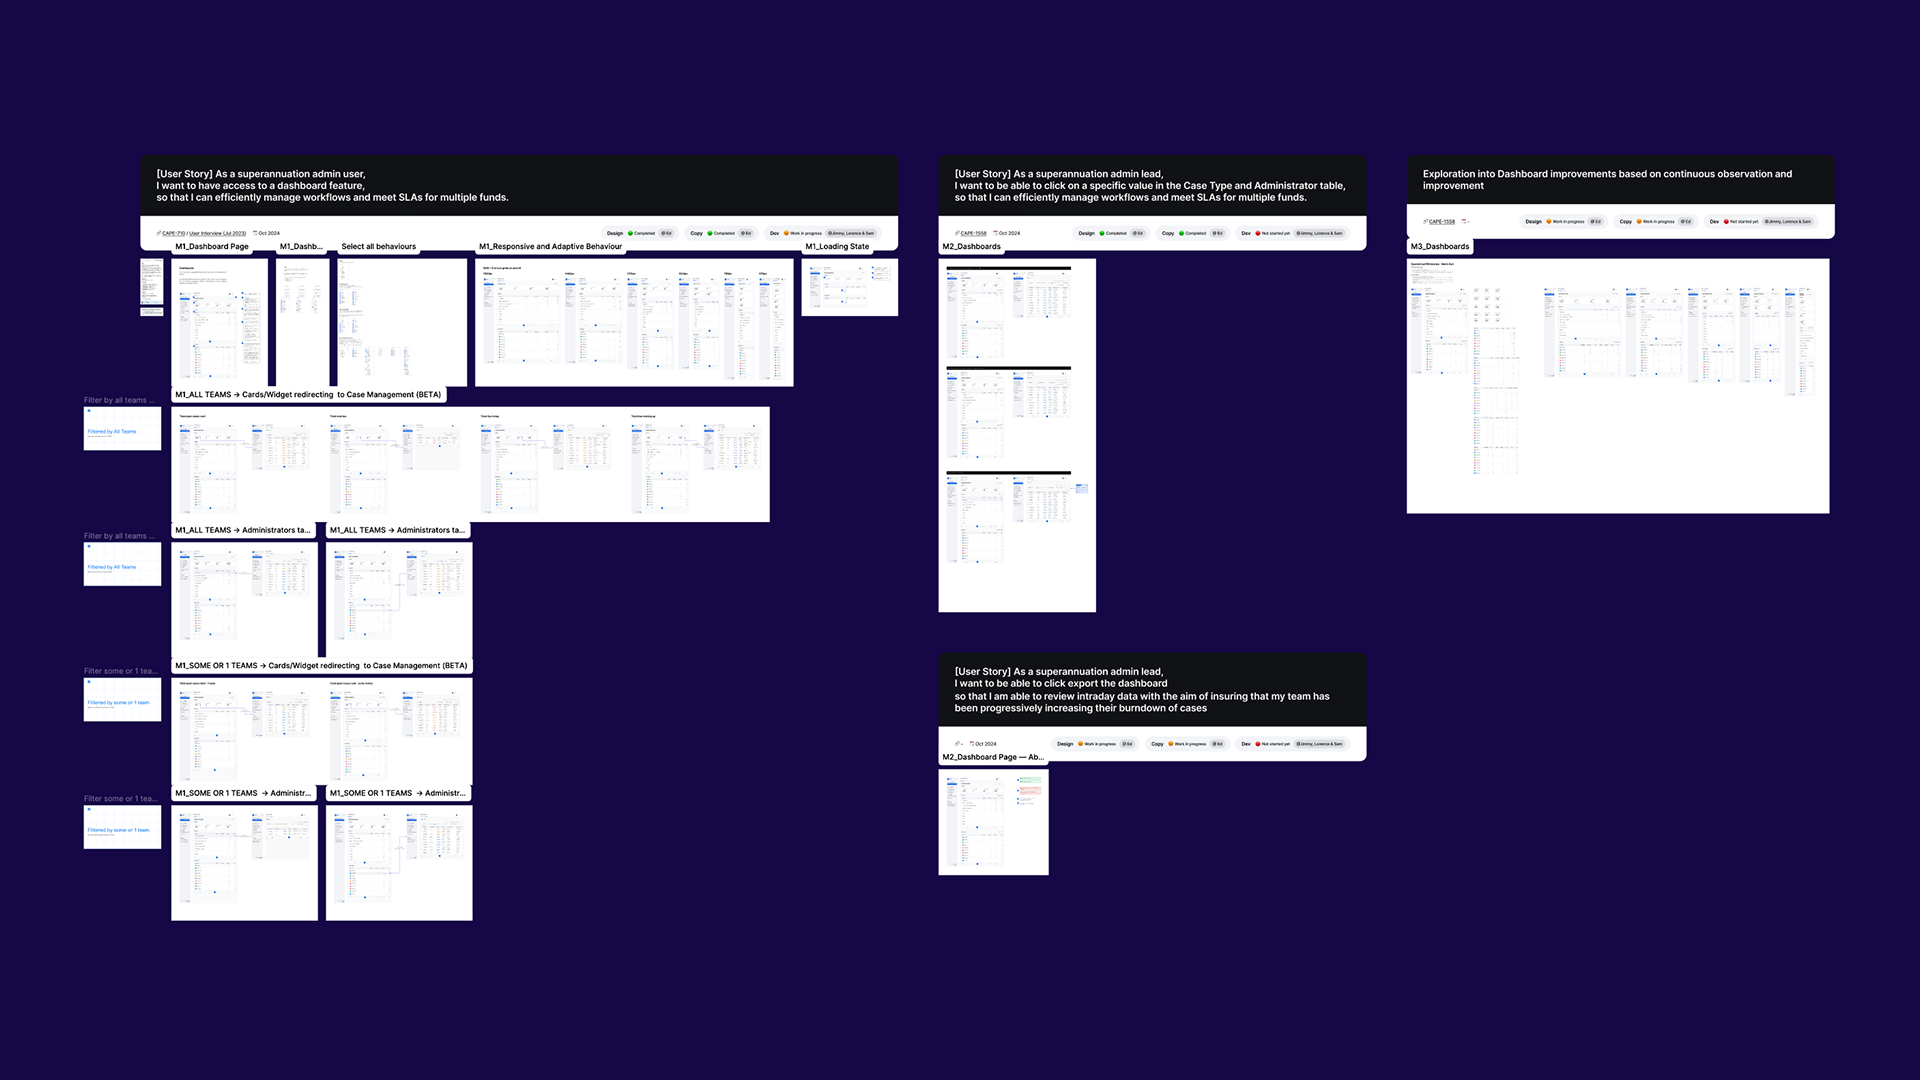
Delivery and handoff
Collaborating closely with the squad we groomed the work into FE, BE and MW tickets for delivery, aligned to our reduced scope and adjusted milestone plan.
The design files were also prepared for handoff detailing all the flows and interactions to ensure clarity and reduce ambiguity during implementation.
Outcomes and impact
Despite the pressure to deliver quickly and the need to simplify the original proposal, we were able to deliver on milestone 1, transitioning a stalled initiative into a live capability.
Today, Dashboards are used daily by Team Leads and Administrative Leaders to monitor and prevent SLA breaches, identify the distribution of work and assess individual performance. This has eliminated the need to use the latent reporting for these tasks and reduced time spent on morning case allocation by up to 80%.


Key learnings
Moving from discovery to delivery requires deliberate action. After two years of stalled discovery and design, the dashboard initiative demonstrated that at a certain point, the value of additional research diminishes in comparison to the learnings gained from shipping and iterating. Establishing clear timelines and scoping boundaries was essential in breaking that cycle and creating momentum. The added business pressure also was a forcing function to deliver earlier than initially planned.
Stakeholder communication is key to maintaining trust during scope changes. Despite the business pressure changing the original proposal, the playback session with administrators ensured transparency and by walking through the rationale, we maintained buy-in and confidence in the solution.
Next steps
Whilst the initial Dashboard has been well received by our Administrative Leaders, there are still improvements that can be made and the remainder of the milestones to be executed on to provide further value.
- Deliver all milestones to provide our administrators with their own curated dashboard to improve workflow
- Continue to improve our MVP Dashboard to include additional data points such as on hold cases and performance metrics
- Monitor and observe usage from Team Leads to determine if any improvements are required